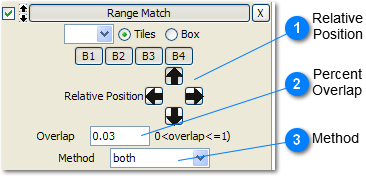
Basic Description: Range Match eliminates or diminishes edge discontinuities between tiles by modifying the values within one tile to make them equal or similar to an adjacent tile. Essentially, this operation attempts to matches a tile to its neighbor. The Overlap parameter lets you choose the percentage of the tile and the neighboring tile that is used in the correction algorithm. Using only the mean simply adds or subtracts a constant value to the tile. Using the standard deviation multiplies the tile by a number, which attempts to match the contrast of the tile and its neighbor. You can choose both to match both the mean and standard deviation. Finally, if you choose the trend method, the tile is sloped up or down to match the neighboring tile, while the values on the edge opposite the shared edge remain fixed.
Warning: if you match toward an area that has no data, the selected area will be filled with no data values (NaN; dummy). The Fill Operation should be used first in these cases.
Technical Details: Range Match changes the values in the selected tile(s) by
a. Mean: Adding or subtracting a constant so the mean of the selected tile region is equal to the mean of the neighboring tile region (defined by the overlap parameter).
b. Standard Deviation: Multiplying by a constant value so the standard deviation of the selected tile region is equal to the standard deviation of the neighboring tile region (define by the overlap parameter)
c. Both: Matching both the mean and the standard deviation (both a & b above).
d. Trend: applying a linear transformation across the tile that matches the chosen edge while keeping the opposing edge of the selected tile unchanged. The adjustment is linear from the matching edge to the opposite edge.
Instructions: After choosing a selection method and making your selection on the survey, enter parameters in the following order (go to each section for details):
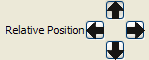
 Relative Position
The selected tiles or area will be matched to a tile or equal sized area in the chosen direction. The arrow appears darker once selected (in the example above it is the up arrow).
|
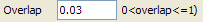
 Percent Overlap
Choose a value greater than zero but less than or equal to 1 to represent the percentage of the selected area and neighboring area that will be used to calculate the statistics for performing the match operation. Often a very small percentage, 0.03 for example, makes a good match because only the values from very close to the tile/region edge are used. In other cases very high values may work well.
|
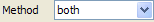
 Method
Choose a method for matching the selected area to the neighboring region.
If you choose mean, the mean of the selected area will be changed so that it matches that of the neighboring region
If you choose standard deviation, the standard deviation of the selected are will be changed so that it matches that of the neighboring region. This often works well when two neighboring tiles appear to have very different levels of contrast.
If you choose both, both the mean and standard deviation of the selected area will be changed so that they match that of the neighboring region.
|