|
4.1.4 Survey Display Controls
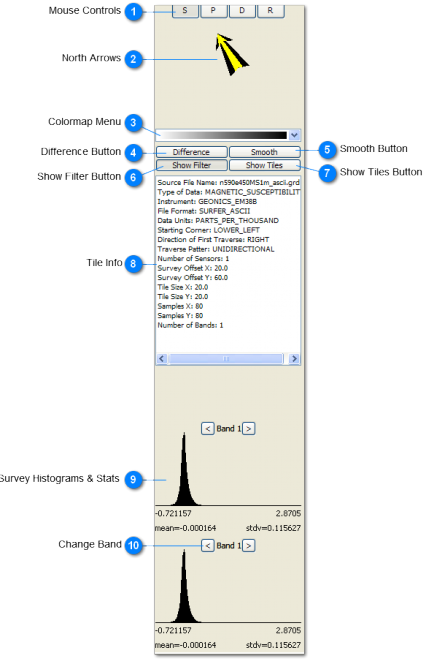
 Mouse Controls
The Mouse Control Buttons are an alternative way of controlling your view if you are not using a 3-button wheel mouse. You can navigate your view and make selections using only one mouse button (the left button on a 2 or 3 button mouse).
The mouse control buttons work as follows:
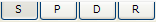
S - Select. Use to select tiles to see Tile Info or make selections for an operation. This is the equivalent of a left-mouse button on any mouse.
P - Pan. Use to pan or move the survey around. This is equivalent to clicking the center mouse button or wheel.
D - Dolly. Use this to zoom in and out (click and hold while dragging the mouse curser up and down the screen). This is equivalent to using the mouse wheel.
R - Rotate. Use to rotate the survey and change the viewing angle. This is equivalent to right mouse button on a 2- or 3- button mouse. *If you change the viewing angle to zero for a flat survey it will disappear.
Note: to get back to a north-up, flat view right click on the survey name and select "go to survey."
|
 North Arrows
The black arrow indicates the direction of north specified by the azimuth entered in the Survey Tool.
The yellow arrow indicates the direction of grid north, or whatever direction is "up" for your survey according to how it was put together or surveyed. These are set when a new survey is created, and can be edited using the Survey Tool. |
 Colormap Menu
Select from a variety of colormaps to display surveys.
|
 Difference Button
Use this button to see the difference between the survey before and after a single operation or the whole operation stack is run. The button functions in two ways.
1. When all checked operations have been run and all are closed (collapsed), the difference button shows the difference between the original survey (before any operations were run), and the final result.
2. When you click on any operation in the stack, you will see the difference between the survey before and after that operation was run. You can therefore click on each operation bar in the stack to see what was removed. If nothing was removed (in the case of resample, for example) then the difference is zero and you will see one solid color for the whole survey.
|
 Smooth Button
This button applies a smooth operation on the fly. The smoothing is only for the display and the data are not actually modified.
|
 Show Filter Button
The Show Filter button is depressed by default. It shows which tiles or regions have been selected for an operation when the operation is open (expanded). Selected areas are visible by a translucent, checkered pattern visible on top of them. If you would rather not see these selections, un-depress this button.
|
 Show Tiles Button
Clicking the show tiles button will show the boundaries of each tile in yellow.
|
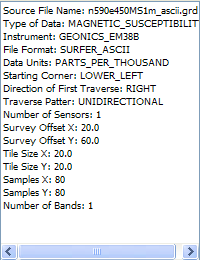
 Tile Info
The information associated with a tile can be shown here by clicking on that tile in the Main Window with the mouse. Most of this information is originally entered when tiles are imported during the creation of a new survey, or if they are modified using the survey tool. The number of samples in X and Y is taken directly from the tile file and changes accordingly if resample has been run.
|
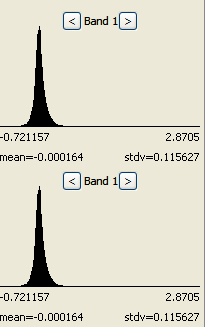
 Survey Histograms & Stats
A histogram for the entire survey is displayed at the top, while the bottom shows a histogram of selected tiles or a region based on the currently open or most recently run operation. If you choose "all" for the operation selection then the histograms will match. Othwerwise, the upper histogram refers to the entire survey and the lower to the most recently selected region.
Along the bottom of each histogram you can see the minimum and maximum data values, and the mean and standard deviation.
|
 Change Band
Use these arrows to scroll through the histograms for different bands in a multi-band survey.
|
|
|