Basic Description: The Band Calculator allows you to perform a variety of mathematical operations to single bands of a survey, or between corresponding pixels of multiple bands. This is a powerful operation with a large number – too many to list - of possible uses. However, some examples which show the range of possible uses are provided below:
a) Selected areas can be multiplied by a factor or a constant can be added, as an alternative to the Match operation. For example, if you want to multiply the selected pixels in Band 1 by a factor of 2, and you wish to have the results overwrite the data in band 1, enter B1 = B1*2. If you would rather have the results stored in a new band, use the Add a Band command from the Tools Menu, and designate the new band as the output band (B2 = B1*2).
b) Power functions can be used to change the shape of a survey's histogram, which sometimes improves the contrast. GPR slices sometimes have a highly skewed distribution, and benefit from a square or cubed root function. To take the square root, enter the expression =B1^.5. Or to square the values enter =B1^2. To raise all values to the power of ten, enter B1^10, and so on. Sometimes a power of .2 or .3 works well to transform skewed GPR histograms to a more normal distribution.
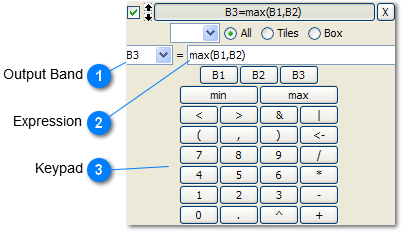
c) Multiple bands can be integrated or fused together using the band calculator. The maximum or minimum values of all corresponding pixels across many bands can be taken using the max and min functions. The example used in the instructions below shows the expression B3=max(B1,B2). This expression will operate on every pixel, and for each one the max between bands 1 and 2 will be determined and saved in band 3. Band 3 was created using the Add a band command, so the results would not overwrite one of the original bands.
d) Logical expressions are also supported. For example, the expression B3=(B1<B2) would show every sample location where B1 is less than B2. The expression B3=(B1<B2)*B1 would return the values from B1 wherever it is less than B2 (if the evaluation of (B1<B2) is true, it would return a one.
Instructions: Choose a selection method and make your selection on the survey, then enter an expression using the guidelines below.
 Output Band
The result of any expression you enter will overwrite a band that you select. You can overwrite an existing band, or add a band.
|
 Expression
An expression can be entered using the keypad (recommended) or with your keyboard. Always reference the band or bands on which you would like to operate. As an example, if you want to add 10 to a single-band survey, you must enter B1+10 (not just +10) in the expression box.
|
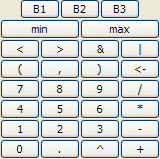
 Keypad
Here is a description of the keypad buttons:
B1, B2, B3, etc.: These stand for Band1, Band2, Band3, etc. Use these to indicate bands in an expression
min: allows you to take the minimum of two or more bands, pixel-by-pixel. The bands must be entered inside the parentheses, separated by a comma but no space.
max: same as min, but lets you take the maximum value between bands in a survey. In the example expression above the maximum of each pixel of bands 1 and 2 is being taken.
( , ) : Use parentheticals and commas for min and max expressions
<- : Backspace
/ : divide
* : multiply
- : subtract
+ : add
^ : power
|