Basic Description: 1D Fourier uses the Fourier transform to identify and remove periodic signals that occur along transects, such as gait signals in magnetometry data. It is similar to 2D Fourier, but the filter is applied only to transects. Gait patterns can look like a series of parallel lines going perpendicular to the direction of survey.
Technical Details: 1D Fourier creates a power spectrum of each traverse in the selected data. When you click on the Filter button you can view the power spectrum and select a range of frequencies to block out. When you click Finish, the mask is applied to the filter and used to do a reverse transform, creating the new survey with the masked features removed.
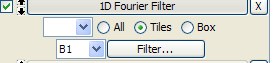
Instructions: After choosing a selection method and making your selection on the survey, click the Filter button to open the 1D FFT Filter Design Tool, where you can create filters. Then finish and run the operation stack. See numbered instructions below.
 Identify Periodic Signals
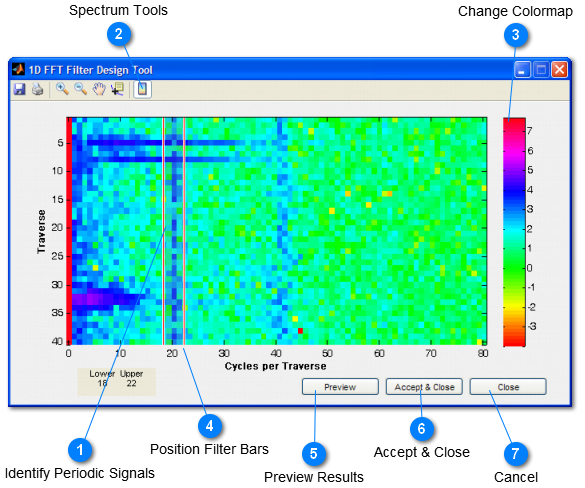
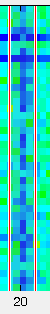
Examine the power spectrum to identify any periodic signals, which will be vertically oriented. In this example, there are two: one close to 20 cycles, and another near 40 cycles. These are both part of the same gait pattern, so the first one should be isolated and removed first, and then if the gait pattern is still present, a second 1D Fourier filter should be used to isolate the second signal.
|
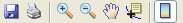
 Spectrum Tools
Tools available in this toolbar, from left to right:
save: save the power spectrum in a variety of image formats
print: print the power spectrum
zoom in
zoom out
pan
data cursor - when this tool is selected you can click in the spectrum to get the exact x,y location and brightness value for any point. When this tool is active you cannot change the colormap
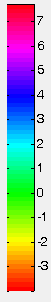
Insert colormap - click the last button to insert a colormap. Then, you can right-click on the colormap to change it. By default it is a grayscale but often using one of the predefined colormaps will make gait patterns more visible.
|
 Change Colormap
When a colormap is displayed, you can right-click to change it.
|
 Position Filter Bars
Drag the red filter bars to either side of the periodic signal that you wish to remove. This selects the frequency range that you wish to remove.
|
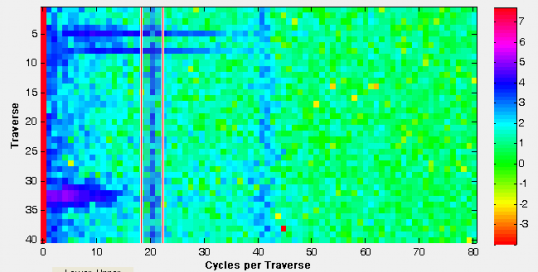
 Preview Results
Click preview to see what a tile will look like if the current filter is applied. To see more than one tile, click Accept and close and run the operation stack.
|
 Accept & Close
Click Accept & Close to accept the filter you have designed and close the filter design tool.
|
 Cancel
Click Close if you want to cancel any changes that you have made and close the filter design tool.
|