Basic Description: Despike finds “spikes” or isolated extreme values and replaces them with a more appropriate value. Spikes are commonly found in resistivity data where false readings are recorded due to contact resistance, but are also found in all other types of geophysical data.
Technical Details: Despike visits each observation location (each pixel) in the image and computes the mean or median of all pixels in the area defined by the filter size. If the value at that location is more or less than the threshold (set by the user in standard deviations), it is replaced by the mean, median, or threshold value (whichever is chosen by the user). Data samples are considered spikes if:
(Data - Mean) / (SD) > threshold (when method = parametric)
(Data - Median) / (IQR) > threshold (when method = nonparametric)
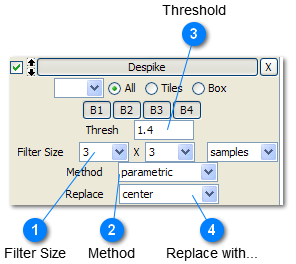
Instructions: After choosing a selection method and making your selection on the survey, enter parameters in the following order (go to each section for details):
 Filter Size
Choose the width and height of the search window. A larger window uses more values to compute the statistics. Generally a small window is all that is needed to find and replace spikes confined to isolated pixels, but if you are trying to remove spikes consisting of a small cluster of pixels try a larger window.
You can use samples (pixels) or meters to define the filter size. If meters are used, the filter will determine how many pixels to use and round off by the sampling interval. Using meters is particularly useful when you have tiles with different sampling densities in the same survey. In this case the filter size will remain roughly the same across all tiles.
|
 Method
If method is parametric, the filter uses the mean and standard deviation to build the filter.
If method is nonparametric, the filter uses the median and the inter-quartile range.
|
 Threshold
If method is parametric, this value is the number of standard deviations away from the mean that a value must exceed to be considered a “spike”. Use the histogram and statistics given in the sidebar to help determine a starting value, and then experiment with different values. If the operation identifies too many spikes, increase the threshold value and rerun the operation. If the operation fails to identify enough data spikes, decrease the threshold value.
If using the nonparametric method, the inter-quartile range is used rather than standard deviations.
|
 Replace with...
Data spikes are replaced by:
a. the center value - mean if method = parametric, median if method = nonparametric.
b. the threshold value – the spike is replaced with the value of the threshold. Use threshold if you want the spikes to remain anomalous, but not extreme.
c. NaN – the spike is replaced with NaN (not a number). This works well when you are experimenting with the other parameters because it shows very clearly where spikes were found and replaced. Once you are happy with the other parameters you can change this to center or threshold.
|